When you listen to Charles describe the chart it might sound totally random, but once you learn the terminology, you will find the profile and Charles’ commentary to be very powerful.
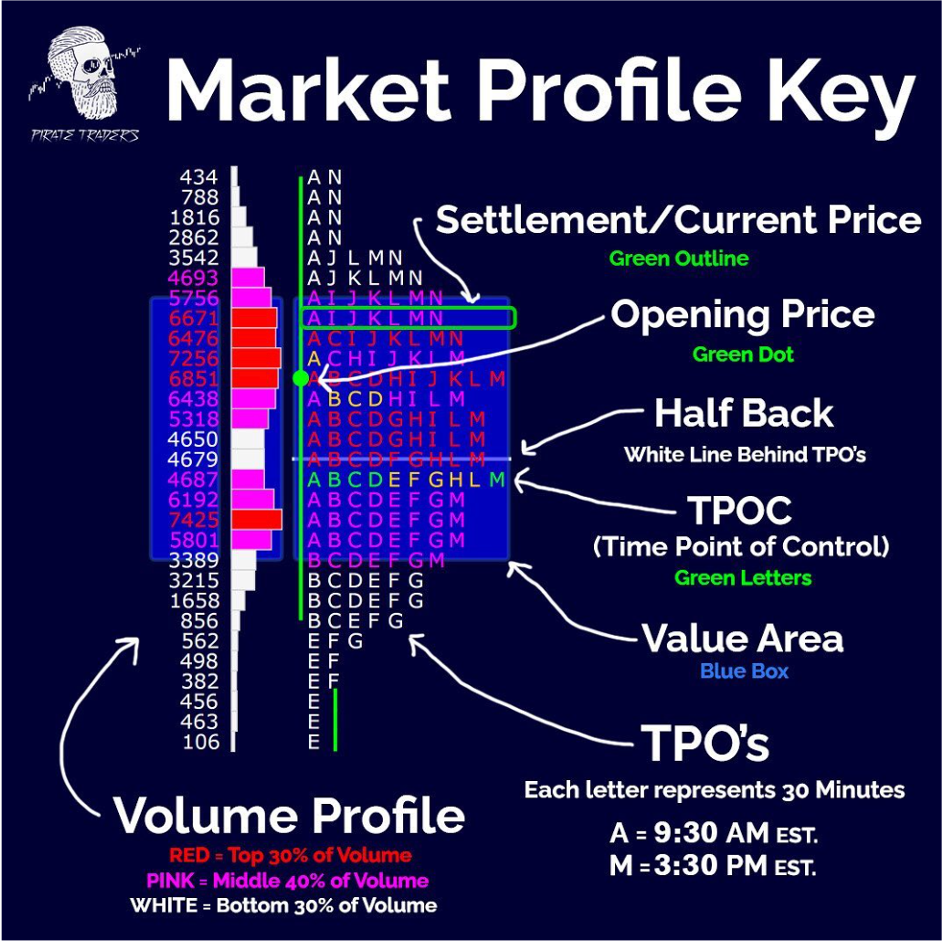
A TPO means “Time Price Opportunity”. It’s visualized on the chart as the letters that are running up and down the vertical access.
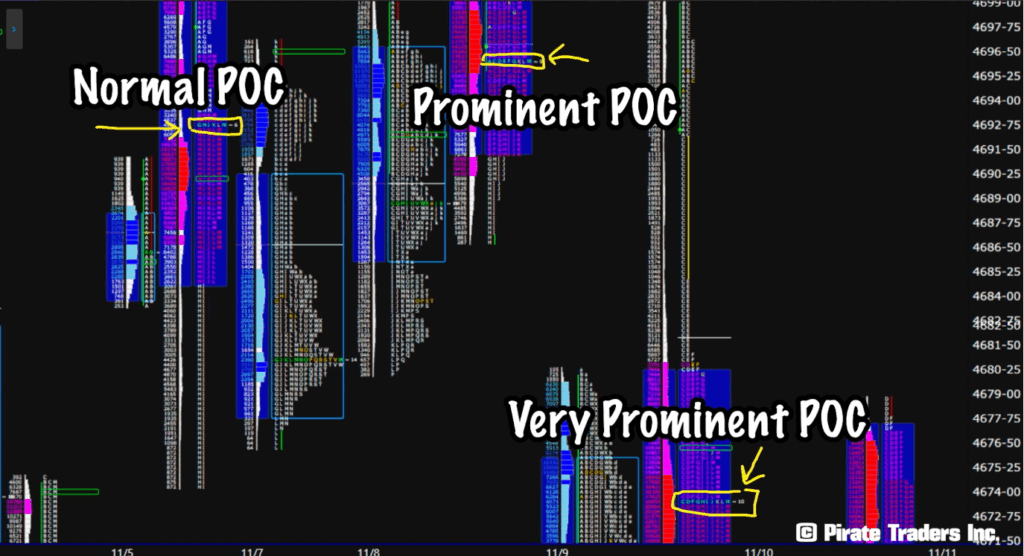
Point of Control
Time POC – The level where the market has spent the most amount of time closest to the center of the range.
Volume POC – Level where the most volume has traded within the range.
We consider this the “Fairest Price to do Business”.
Intraday the TPOC is the target for market to return to especially during rotation.
After the market closes the VPOC is the target for the market to return to if price reenters that day’s range on a subsequent day.
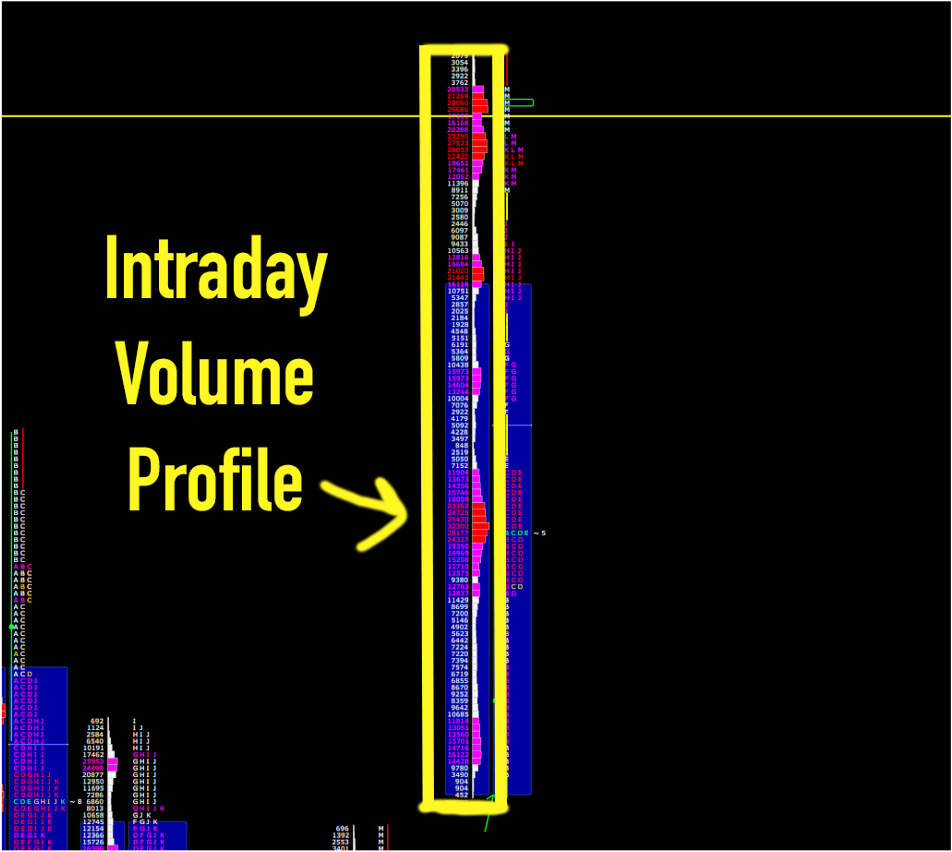
Intraday Volume Profile
Volume profile shows how much volume trades at each level throughout the timeframe of that profile.
We use the volume profile as intraday support and resistance levels as well as areas to look for new business.
Cumulative Volume Profile
Cumulative volume is a combination of the volume profiles over a set range.
For my purposes in day trading, I just need to see where the levels brought in the most volume in the past. Generally just a few months worth of a range is adequate however, at times a larger range may be required if the market has not been at a particular price level for a long period of time.
Value Area
The value area represents the first standard deviation of a completed session or approximately 68% of the trading activity beginning from the point-of-control (POC),(the mean).
Value develops as the day progresses through each half-hour TPO period.
Value-area relationships from day-to-day are described as: higher, lower, overlapping, overlapping higher/lower and inside.
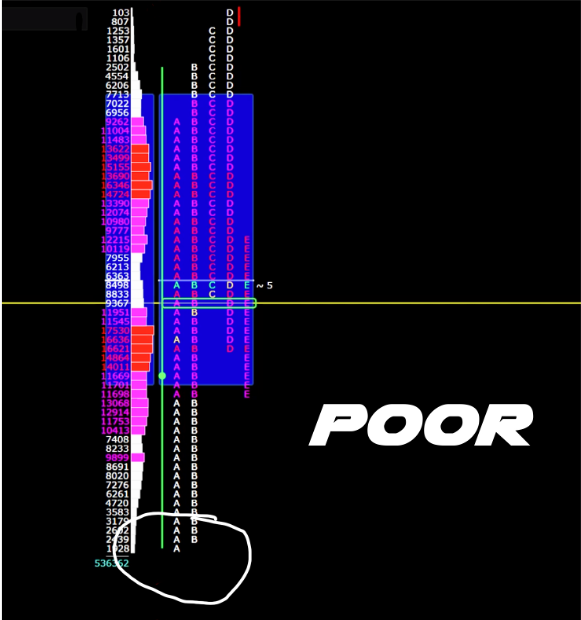
Poor High/Low
A Poor High is created when the high of the session lacks excess.
They can be recognized in the ES* as having less than two letters (TPO’s) of excess at the top of the range.
This implies the auction to the upside is incomplete. It increases the odds this level will be crossed through at some point later in the session.
The price often first pushes away (lower) from the Poor High. The comes back later to cross through (repair) it.
A poor low is the same as a poor high, but at the bottom of the range.
*Every market is different. They all have different rhythms, patterns, and volatility. So, each trader must figure out what are the “Norms” for their particular market or asset. For example, they may find 3 ticks is good excess, because most of the highs and lows in that market are three or more ticks in size.
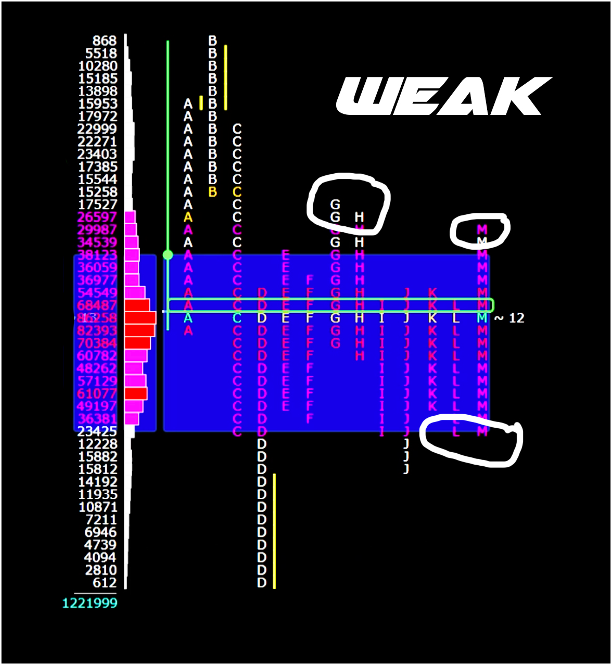
Weak High/Low
A Weak High is similar to a Poor High but with some import differentiations.
A Weak High is formed when the market creates a high on a TPO within one letter of a previous technical or profile level. For example; highs/lows of previous 30 minute TPOs, previous day’s highs/lows, the previous day’s settlement, or the current session’s open.
Weak highs can act as a magnet for price. One doesn’t mean much, but the more Weak References you have above price the higher the probability that at least the first of the Weak References will be repaired (more references = stronger magnet).
Weak Highs are repaired when the market pushes through creating at least two letters of excess above them.
A weak low is the same as a weak high but at the bottom of reference.
Single Prints
Any level on the Y access inside the range with only one TPO.
Single Prints are a form of weakness and increase the odds of backfilling (returning to where they start) but often “the base” or start of the single prints then acts as support or resistance.
If single prints remain at the open 1 hour after they are created it is a sign the momentum will continue intraday.
If the singles remain at the close of the session at 4pm EST. They are a sign the momentum will continue the next. If it does not they are target for the market to return to on a subsequent day.
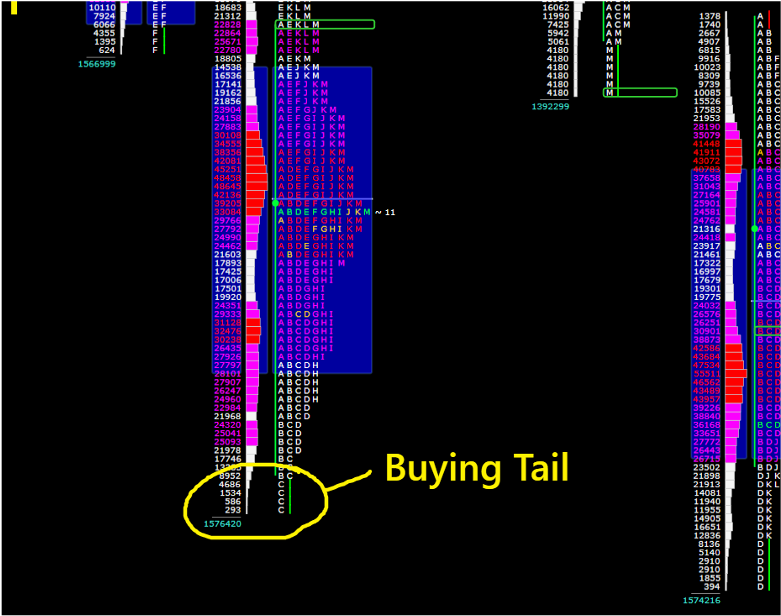
Buying Tail
Excess at the Bottom of a range, defined as at least two TPO’s (letters) on the ES.
Selling Tail
Excess at the Top of a range, defined as at least two TPO’s (letters) on the ES.
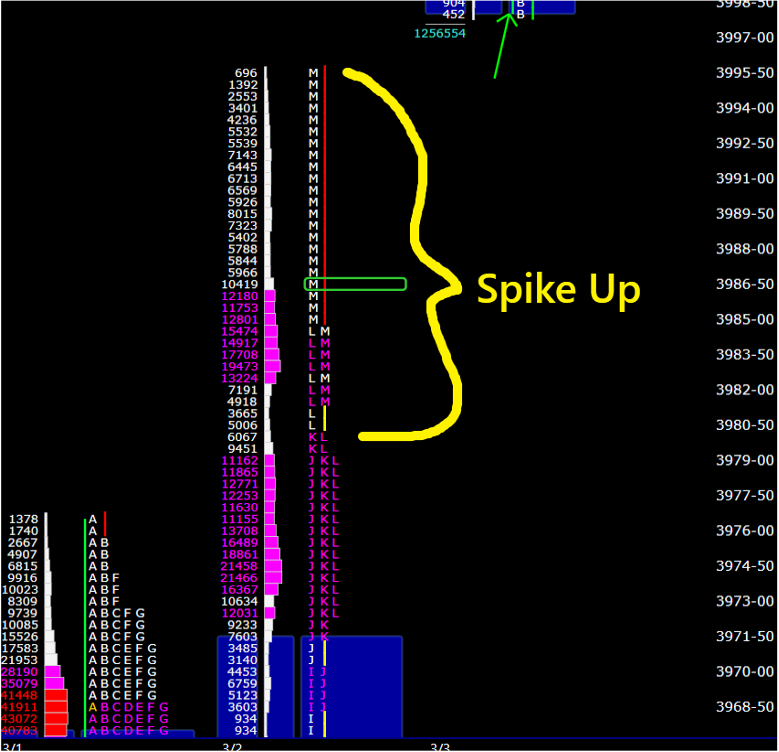
Spike
A Spike is defined as single prints at the high or low of the day’s range that are formed in the last hour of the day (3-4 pm ET). The price must close inside the Spike, otherwise it is considered a Liquidation Break or short covering rally.
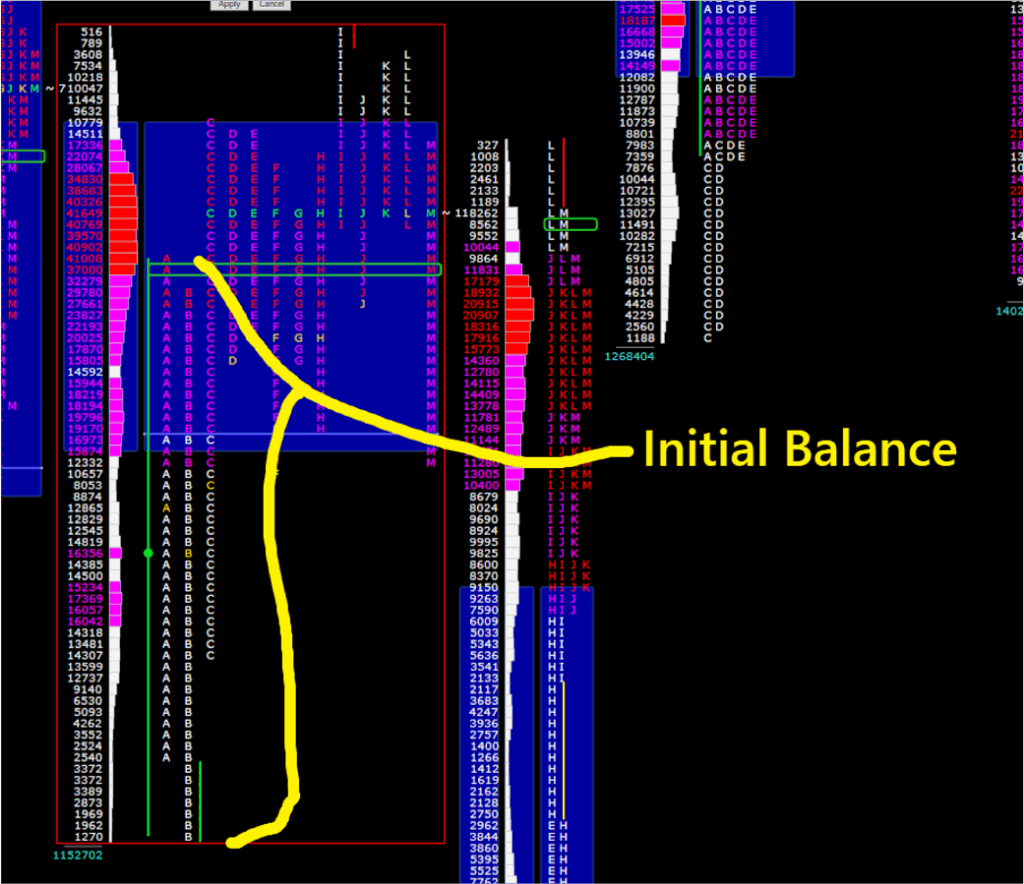
Initial Balance
The Range the markets trades in during the first hour of the session. Between 9:30 – 10:30 AM ET.
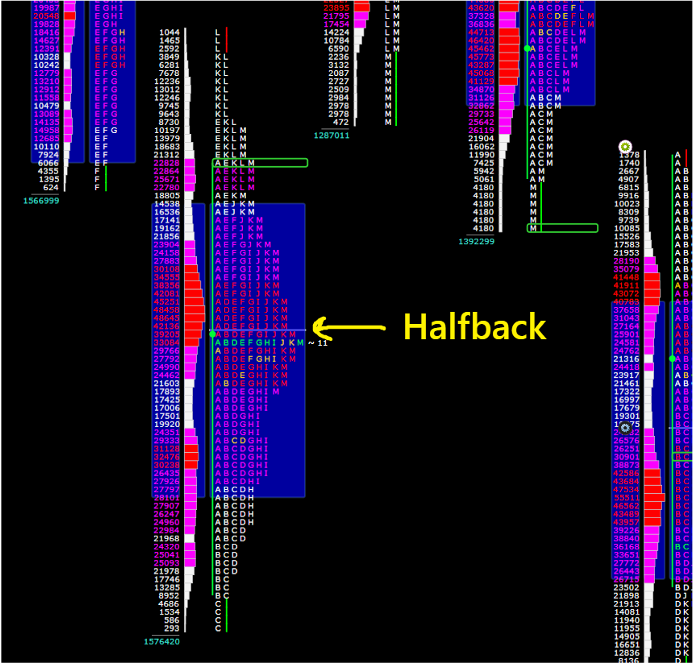
Halfback
50% of the day’s range.
This midway point often acts as support or resistance, and is particularly valuable when the market is chopping around inside the previous day’s range during the inimical balance.
Auction Process Terminology
Balance Rules
A market is in balance when it’s consolidating in a specific range. It can happen on a very short term (over a period of minutes) or a longer term (over a period of days/weeks/months/years).
The tighter the range or the longer the market spends in that range the more potent the Balance Rules become (two or more days = very potent).
These rules are nothing more than a framework of scenarios that are the most probable to happen. It’s important to remember this does not have-to happen, the market is random and a trader should always remain open to any possibility.
Probable outcomes of a Balance Area and how to trade them:
1.Look above and go: Prices move above the high of the balance area, find support (acceptance), then continue higher. The target should be double the balance area.
2. Look above and fail: Prices move above the high of the balance area but fail to find support and reverse back into the balance area. This is now a short with a stop above the new high the market just made above the previous balance area high, with a target to the opposing end of balance, the balance area low.
3. Look below and go: Prices move below the balance area low, find resistance, then continue lower. The target should be double the balance area.
4. Look below and fail: Prices move below the low of the balance area, but find support and push back up into the balance area. This is now a long with a stop below the new low the market just made below the previous balance area low, with a target to the opposing end of balance, the balance area high.
5. Remain in balance: Prices remain within the balance area. Trade it as you would rotation; look for smaller counter-trend moves against the extremes of balance and/or technical/market profile reference levels.
Liquidation Break
A Liquidation Break happens when the market gets itself overly long. The late majority and laggard buyers run out, then as the market begins to pull-back they panic sell their positions. This causes an abrupt drop in the market.
Recognizing liquidations allows a trader to avoid panic and choose the most effective response.
They can be recognized by these characteristics:
They often start suddenly and at a moment that doesn’t suggest a reason for such an abrupt and violent move.
They are not news driven. Rapid tempo out of nowhere.
They will retrace 100%. Normally relatively quickly, but sometimes as late as the next day.
In most cases liquidation breaks happen very quickly, they retrace quickly and the market continues to push higher again. This is because as Jim Dalton would say “sometimes a market has to break before it can rally”. The liquidation shakes the weak handed longs out of the market and brings in strong handed buyers who see the discount as an opportunity. So, by the time the market retraces 100% the traders holding the longs are mostly all in the profits, at the exact place the laggards were buying the overpriced longs shortly before.
Less often, but sometimes, a Liquidation Break can bring in “new money sellers” to the market. That is to say not just the longs exiting their positions but new traders going short with the momentum. This will bring the Liquidation Break to an end, and begin a new auction, usually to the downside.
Signs the Liquidation Break is over.
Once the tempo slows for a significant amount of time and the market grinds at lower levels.
If the market has dropped and retraced 100% and is now falling again.
Seeing Volume build with the tick chart in the negative.