
A common question I get is people asking how to set up their market internals to match mine. It’s important to understand that there is no one way to look at anything in the market. For example, all of my internals are set to 15-minute candles. That is only because when I use to trade with candlesticks, I found the 15-minute to be the most useful. 5-minute was too busy for me, it provided too much information, which felt like noise. 30-minute was too slow for me, I couldn’t wait that long for a new signal. So 15-minute candles were my sweet spot. When I began to learn to read internals it made sense to me to just keep them all on the same time frame. However you should experiment and find what is right for you. For example, with the TICKS many people watch 1-minute or 5-minute TICKS and find it very useful.
I use think or swim as the platform of choice however you should be able to view these on any trading platform.

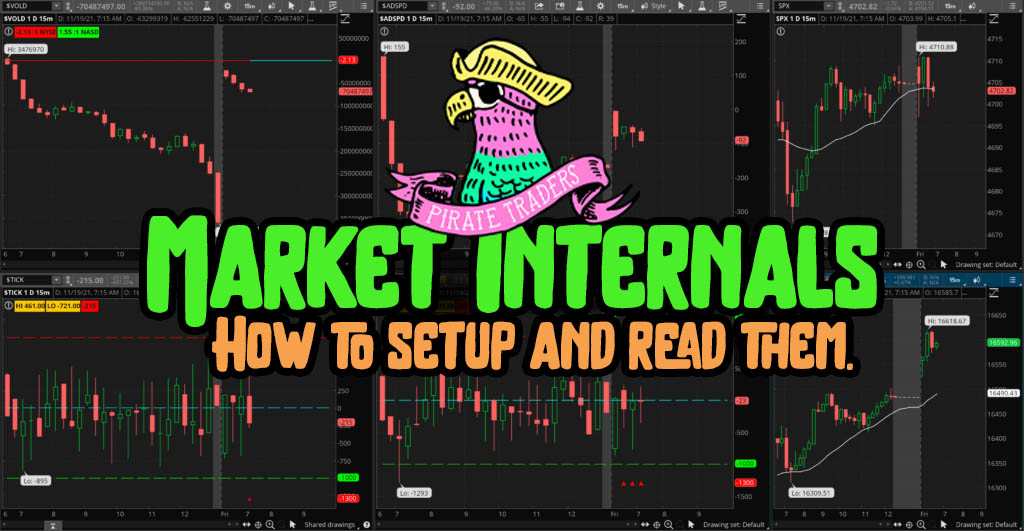
Top left – VOLD is the difference between the up volume and down volume on the NYSE. I look for is it above or below the zero line. Above bullish, below bearish. And is it trending in a particular direction.

Top Middle – ADSPD refers to the number of S&P 500 stocks that closed at a higher and those that closed at a lower price than the previous 15 minutes (or whatever time frame you have it set to). I look at them the same as the VOLD.
If your trading platform does not have ADSPD it should have ADD; which is for the entire market, it is just as useful and reads exactly the same way.

Top Right – SPX on the 15-minute candles. I look at what is happening with the 20-simple moving average. The is an import level due to obvious algorithmic trading. There are very powerful algos that buy when the market pushes into the 20 SMA from above, and sell when it pushes into it from below. So it makes a very strong support and resistance reference. It has the power to reverse a trend. The reason I use the SPX is because this SMA only works if it’s just calculated by the regular trading hours (9:30AM-4:00PM New York Time) you can also use the futures but you must make sure your chart only includes those regular trading hours.

Bottom Left – TICK compares the number of stocks that are rising to the number of stocks that are falling on the NYSE. The index measures stocks making an uptick and subtracts stocks making a downtick. Again, I look for is it above or below the zero line. Above bullish, below bearish. And is it trending in a particular direction. Also if the trend abruptly changes that is a sign of a change in the market (reversal). The Tick is also the only true leading indicator (kind of), the others are much slower.
You can find the script for the Tick Values indicator I use to show were the +-1000 levels and zero line are on the shadow trader website.

Bottom Middle – TICKQ same as the TICK but for the NASDAQ

Bottom right – NDX…. Same as SPX
If you have any questions about my set up please feel free to reach out [email protected]